
Executive Summary:
Optimism is running high because of the pro-business reforms the Trump Administration has on its agenda. The stock market has been on a tear since the election and a global synchronized improvement in economic strength is helping to fuel the gains. Further near-term upside in the U.S. stock market may hinge on progress made in passing the more important parts of the president’s program, beginning with healthcare reform, tax-reform, deregulation and infrastructure spending. Foreign equities are finding strength from the improving global economy.
Eight years into the recovery from the Great Recession, the U.S. business cycle appears to be well into the mid-expansion phase. Three interest rate increases from the Federal Reserve is moving the Central Bank to a more neutral policy stance and away from a period of extraordinary monetary stimulus. The time left in this expansion and bull market hinge on several factors, including the time it takes to transition to the late-expansion phase and beyond, and the pace at which the Federal Reserve is required to raise rates to dampen future inflationary pressures.
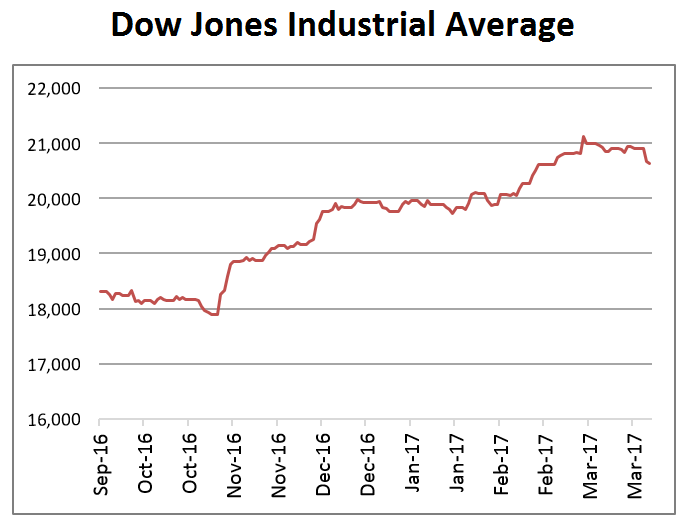
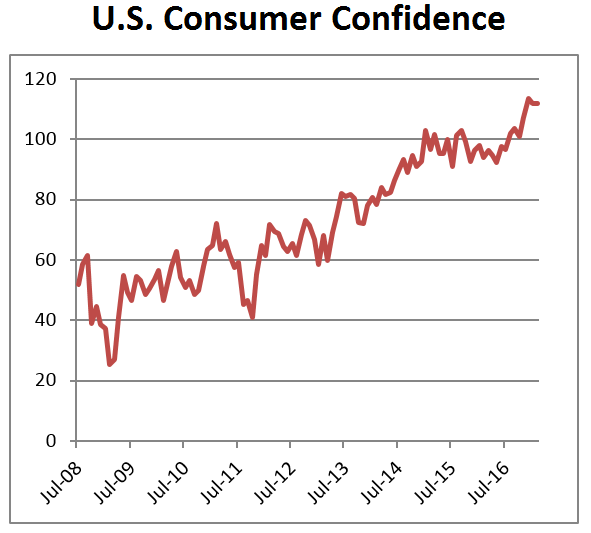
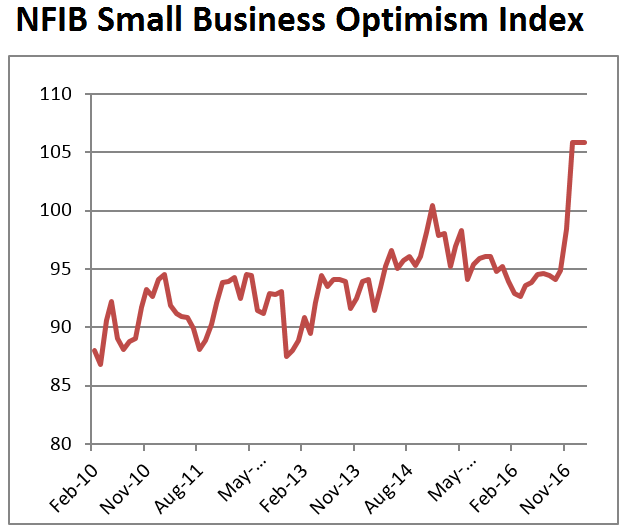
The Dow Jones Industrial Average sprinted 2,780 points higher since the U.S. Presidential election, slicing through the landmark 20,000 level on its way to 21,115. Consumer and business confidence also burst through multi-year highs. All this positive sentiment reflects tremendous optimism the pro-business Trump agenda will be accomplished in the months ahead. In recent days, the markets have begun to realize there will be delays and set-backs along the way to achieving this ambitious agenda, as the efforts to repeal and replace the Affordable Care Act have been met with significant challenges. The Dow so far has suffered only a modest 2% pull-back from the recent highs, but it highlights the sensitivity the stock market has to delays that risk becoming more significant barriers to the broader pro-growth agenda. Despite the recent worries, it is widely expected a healthcare bill will pass and the other agenda items will fall next in line.
Sir John Templeton, the creator of the Templeton Growth Fund and one of the best stock pickers of all time, said in February 1994, “Bull markets are born on pessimism, grow on skepticism, mature on optimism and die on euphoria.”
This investment wisdom is useful today to use as guidance on where we might be in the current stock market advance. As the charts below show, both small business and consumer optimism is surging higher since the Presidential election and taking the stock market with it. The bull market is mature, since it’s been 8 years since the Dow Jones 30 Industrials began its advance from the market’s low on March 6, 2009. This is one of the market’s longest post war advances, coinciding with one of the longest economic recoveries. If he were alive today, Sir John Templeton would be telling us to watch carefully for the euphoria phase, which would mark the final phase of most bull markets.
Is the Bull Market Running out of Steam?
Templeton’s sage advice was given to provide landmarks of what to look for next in a market cycle, yet he purposely left out any reference to how long each phase would last. It is left to us to try to figure out a timeline.
Per the chief researcher of the San Francisco Federal Reserve Bank, Glenn Rudebusch, the extended duration of the current economic expansion doesn’t necessarily mean the end of the bull market or the business cycle is at hand or that recession is around the corner. In the February 4, 2016 FRBSF Economic Letter, entitled, “Will the Economic Recovery Die of Old Age?”, Mr. Rudebusch explained that economic expansions “do not become progressively more fragile with age … and based only on age, an 80-month-old expansion has effectively the same chance of ending as a 40-month-old expansion.” This offers some comfort to those thinking it is destiny for this aging recovery to end very soon. Still, it’s wise we think more carefully how we invest and scrutinize both fundamental and technical data more vigilantly to watch for signs when the next bear market or recession could come.
The Business Cycle
The business cycle gives us some of the best clues about how much time we still have in this expansion. For those unfamiliar with business cycles, simply put, the business cycle reflects the fluctuation of economic activity above and below the long-term trend of growth in the economy. These fluctuations typically involve periods of rapid growth and other periods of relative stagnation or decline. The cycle typically plays out over several years, often 4 or 5, but occasionally a few years longer. The reason the business cycle is important is it has a significant influence on which asset classes and equity sectors perform the best. More importantly, the end game of most cycles is a recession, which can have a very adverse impact on investments considered ‘risk assets’, such as stocks, high yield bonds, real estate, commodities and currencies. Rarely do markets sell off extraordinarily, i.e., beyond a typical correction, without being accompanied by a recession.
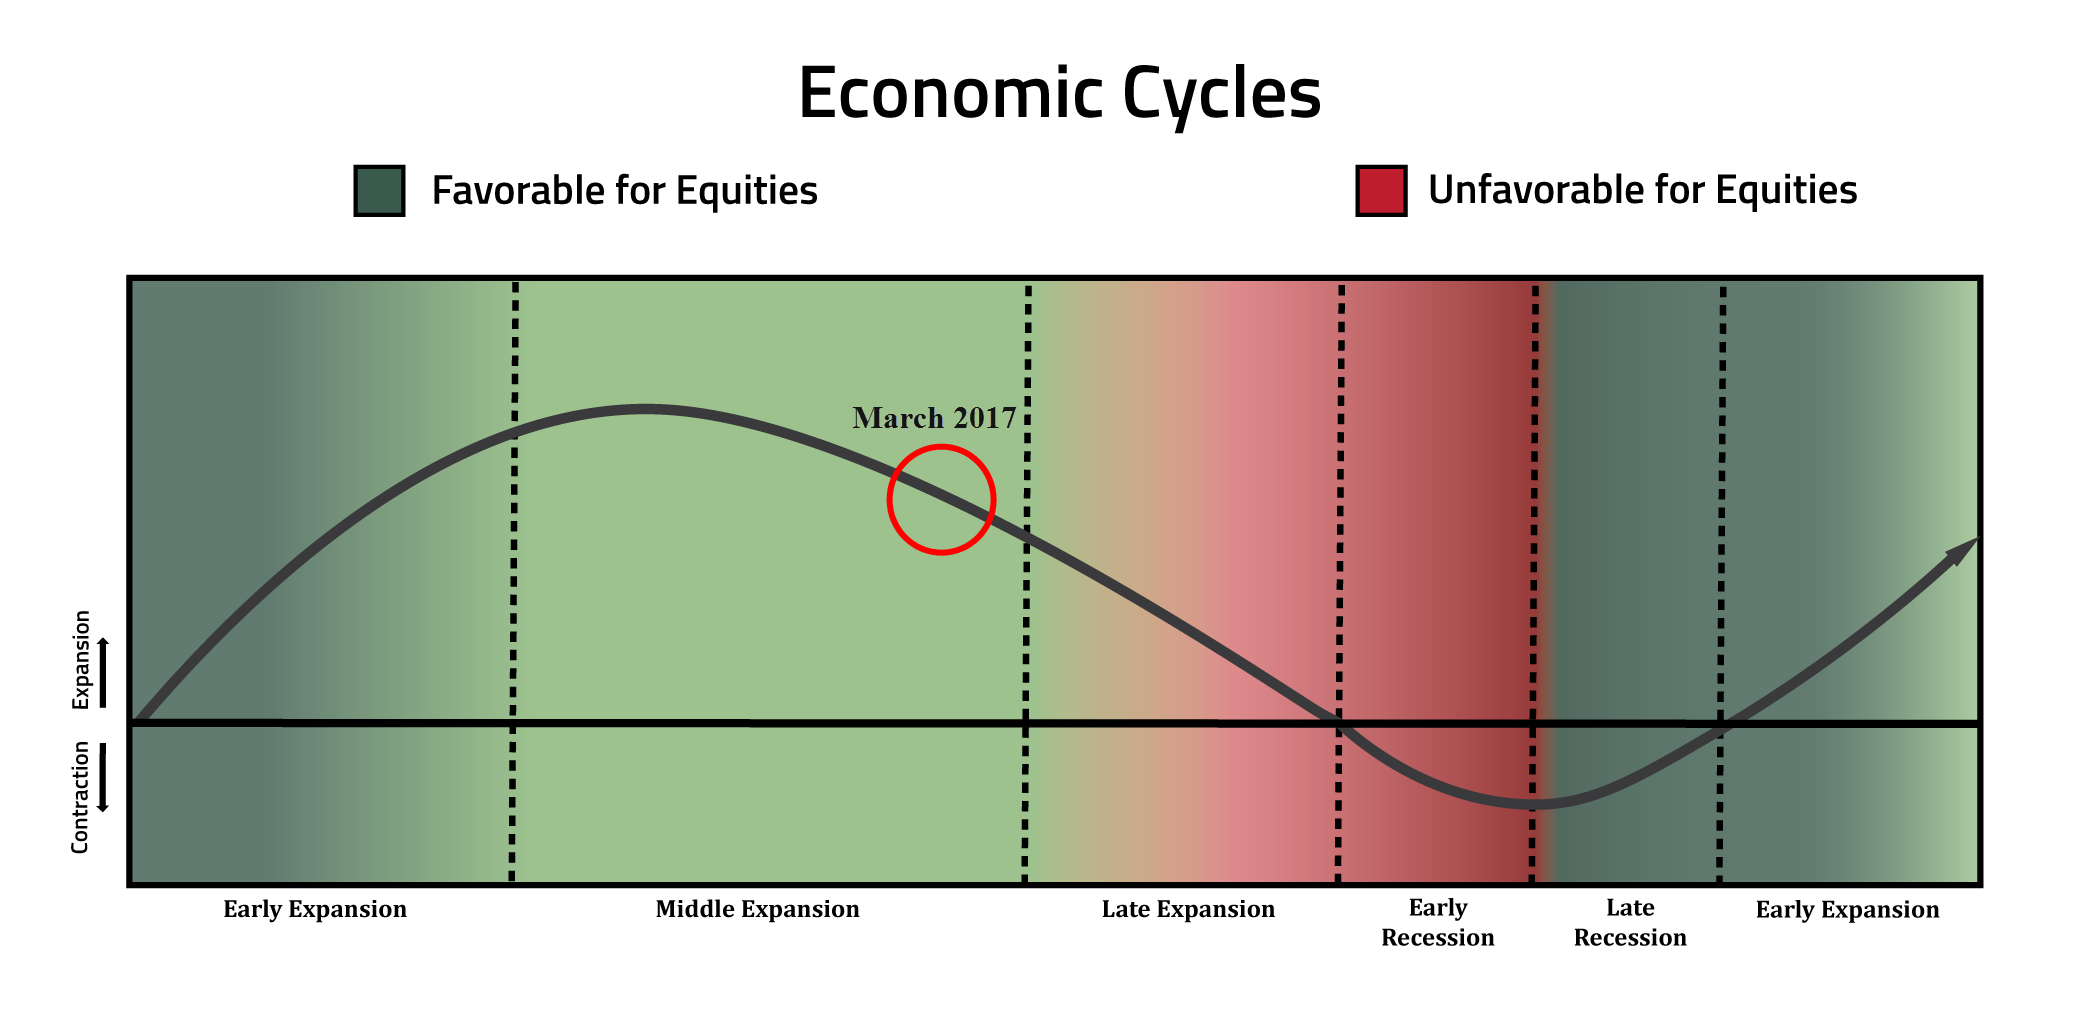
There are many things we look for to give us a sign of where we are in the current business cycle, such as consumer and business confidence, corporate earnings growth rates, unemployment rates, measures of inflation, the shape of the yield curve, credit spreads and other indicators of economic strength. Even though each business cycle varies, there are detectable patterns that are helpful in managing tactical portfolios. To provide a brief background on this topic, the chart below depicts 5 phases that occur in most business cycles.
Here is a brief description of each phase:
The ‘early expansion’ phase of the business cycle marks a strong economic recovery from recession into expansion. Capital and residential investment are low as a percentage of GDP and consumption is low. Price inflation is below the Fed’s targets, unemployment is elevated and wage inflation is low. In this phase, monetary policy is easy, interest rates are low and the yield curve is steep. Credit spreads are wide but diminishing, inventories are low, and a rebound in sales leads to a vigorous increase in profit expectations. Consumer confidence is low, as are savings rates, but the stock market and other risk assets continue a volatile climb that began in the late ‘recession phase’.
The ‘middle expansion’ phase follows with a more moderate rate of economic expansion, credit growth broadens, consumer confidence is improving, savings rates begin to decline, inventories and sales grow, profitability is favorable but profit margins begin to peak. Credit spreads are relatively tight and stable. Unemployment isn’t meaningfully elevated, if at all, and wage inflation is moderate and rising. Consumer inflation is rising and approaching Fed targets. Monetary policy transitions from an easy money environment toward a more neutral stance. Interest rates are rising and the yield curve may begin to flatten as growth expectations moderate. Stock market performance during this period is favorable, but generally less volatile than the ‘early expansion’ phase.
The next phase of the business cycle is the ‘late expansion’ phase. Consumption, capital and residential investment are high. Consumer confidence could be described as exuberant. Unemployment is low, wage inflation is above trend and rising, and consumer price inflation is above the Fed’s target. Monetary and credit conditions become more restrictive, inventories begin to rise and profit margins decline. Credit spreads begin to widen from formerly tight spreads. The yield curve flattens further with the possibility of an inverted yield curve, where short-term rates rise above long-term rates. The stock market and other risk assets typically peak during this phase. Economic growth slows to a crawl, signaling the next phase may be at hand.
Contracting economic activity marks the ‘early recession’ phase. The profit outlook worsens, credit is hard to get and inflation begins to fall, as do interest rates. Consumption, capital investment and residential investment and consumer confidence all fall. Savings rates and unemployment rise and credit spreads widen rapidly. Volatility increases in stocks and other risk assets and perform the worst during this phase of the business cycle. The Federal Reserve eases monetary policy to spur economic recovery.
In the ‘late recession’ phase monetary policy is very easy; interest rates have fallen and the economic contraction has reached its nadir. The yield curve begins to steepen. Credit spreads are wide and volatile, but begin to improve. Investors sensing the worst of the recession will soon be over begin to aggressively buy depressed stocks and other risk assets in anticipation of the economic rebound to come.
The paragraphs above describe a ‘textbook’ business cycle, not necessarily how each business cycle plays out. The economy and its cycles are not oblivious to external influences, such as the global economy, changing government taxes or regulations, wars or a myriad of other factors. U.S. economic growth may ebb and flow at times, lurching forward to the next phase or falling back to the earlier phase. Tallying the observable evidence at any point in time can help pinpoint the current position of the cycle. Despite some obvious challenges in this approach, the exercise itself offers an important framework for isolating the range of potential outcomes most likely to influence our portfolios going forward.
So Where are We in the Current Business Cycle?
Let’s step back a bit to get some perspective of where we have been in recent years. The global financial crisis that began in July of 2007 led to the Great Recession (December ’07 to June ’09), the longest recession since World War II. The length is not surprising, since the global financial crisis was the largest since the Great Depression of the 1930’s. Because of its severity and the unprecedented deficits that resulted, an easy money, low interest rate policy became the primary means used by the Federal Reserve to revive economic growth.
That brings us to present. On March 15, 2017, the Federal Open Market Committee raised its benchmark rate for the second time in three months and the third time since December 2015. It is finally moving towards the end of its nine-year-old stimulus program that included three quantitative easing episodes. Although the current expansion is quite long, the unusually slow growth trajectory of the recovery and the sustained low interest rate environment continue to offer a favorable setting for potentially extending economic growth even longer.
The following slider graphic show the status of several important economic variables that help us to measure the weight of the evidence regarding where we are in the current business cycle (refer to the ‘Economic Cycles’ chart above).
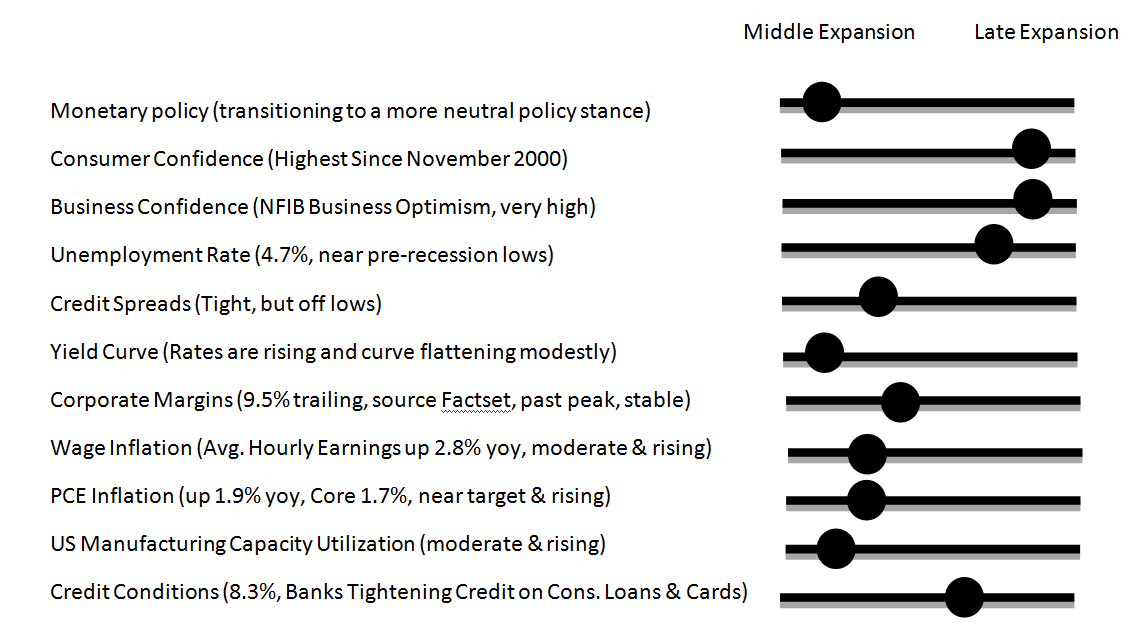
The preponderance of current data supports that we are deep into the middle expansion phase of the business cycle, close to transitioning to the late expansion phase. The U.S. economy is healthy, supported by comparatively low interest rates, strong consumer and business confidence, favorable consumer spending and robust labor markets. Unlike earlier phases of the business cycle, it is no longer clear there is adequate slack remaining in the labor market to restrain inflationary wage pressures if current growth trends persist.
If current trends persist, rising wages coupled with increasing interest expenses will progressively pressure profit margins. It appears margins have already moved past their peak for this cycle. Data is showing a tightening of credit conditions in some of the consumer loan and credit card areas as bankers adjust to the expectations of higher interest rates, a shift that more often appears in the late expansion phase of the business cycle.
Outlook and Asset Class Implications
Despite the signs of the advancing maturity of the current business cycle, there are still no significant indications of overheating or that a recession is on the horizon. The gradual pace the Federal Reserve is taking on hiking rates makes it clear they are doing everything they can to avoid a premature end to the expansion by moving too aggressively with monetary policy tightening. Global monetary and fiscal policy is still accommodative and should help prevent a damaging spike in U.S bond rates. The slow growth trajectory of the recovery and the sustained low interest rate environment continue to offer a favorable setting for potentially extending economic growth for much longer.
Although U.S. stocks are reaching new highs, improving fundamentals and confidence support the potential for further appreciation from current levels. Domestic equities continue to be attractive currently relative to bonds. The potential for favorable tax policy, reduced regulation and a stimulus package from the Trump Administration offer the promise of added boosts to growth. While this should help maintain positive sentiment toward equities in the year ahead, there is a risk that too much stimulus at this stage in the business cycle could accelerate growth too much and hasten the path to the late expansion phase and risk destabilizing economic bottlenecks.
Global growth appears to be both broadening and strengthening. After several years of underperforming U.S. markets, international valuations appear attractive and may already be starting a period of relative outperformance to U.S. equities. Since the first of this year, both the MSCI Emerging Markets index and the MSCI EAFE index are outperforming the S&P 500 materially. Risks stemming from a challenging European political environment may create some uncertainty in the coming weeks ahead, but valuation support suggests it makes sense to maintain exposure there. As event risk clears, European markets will likely continue their catch-up.
In the bond market, Treasury inflation-protected securities (TIPS) may be an attractive alternative to Treasuries in an environment subject to upside surprises in inflation. Floating-rate loans can also be appealing in this environment since their coupons periodically reset based on a floating-rate benchmark. This makes them comparatively insulated from rising rates. We recommend you maintain shorter durations and generally upgrade the quality of your bond portfolio at this stage in the business cycle as increasing inflation usually leads to rising interest rates and declining bond prices.
Commodity prices depend more on current demand levels rather than to future growth rates, like stocks do. Late in the business cycle when demand for commodities is generally on the rise, tighter supplies can cause a scarcity premium to develop. This causes spot commodity prices to rise above production costs to incentivize investment to create supply. This dynamic process generally causes commodities to outperform equities and bonds in this phase of the business cycle.
Conclusion
It appears the U.S. and the world are on a more solid growth trajectory than we were a year ago. It is being dominated by broadening global growth and more reflationary forces rather than deflationary ones. As the U.S. approaches the late expansion phase of its business cycle, it requires we stay vigilant for signs of overheating or dislocations taking place that could shorten the cycle and potentially disrupt the markets. At the same time, this expansion has the potential to extend for some time to come and any efforts to reduce risks to your portfolio prematurely could carry tremendous opportunity costs. We will continue to monitor these important developments and be in touch with any meaningful news. Thank you for reading and if you happen to be a client, thank you for your business!
Disclosures: The views expressed are those of Byron Green as of March 22, 2017 and are subject to change. The information contained herein does not constitute investment advice or take into account any investor’s particular investment objectives, strategies, tax status or investment horizon. Additionally, this publication is not intended as an endorsement of any specific investment. Investing involves risk and you may incur a profit or a loss. Information contained herein is derived from proprietary and non-proprietary sources. We encourage you to consult with your tax or financial advisor. Click here to read the GIM Form ADV Part 2 for a complete list of Green Investment Management’s services.
![]() Click here to download printable PDF of GIM Market Commentary 03-22-2017
Click here to download printable PDF of GIM Market Commentary 03-22-2017