The Guardian Sector model is an active strategy investing into U.S. equity sectors based upon a blend of cyclical trends, relative strength and valuation. The goal is to gain alpha for portfolios by capitalizing on the differing phases of the economic cycle.
What are Sectors?
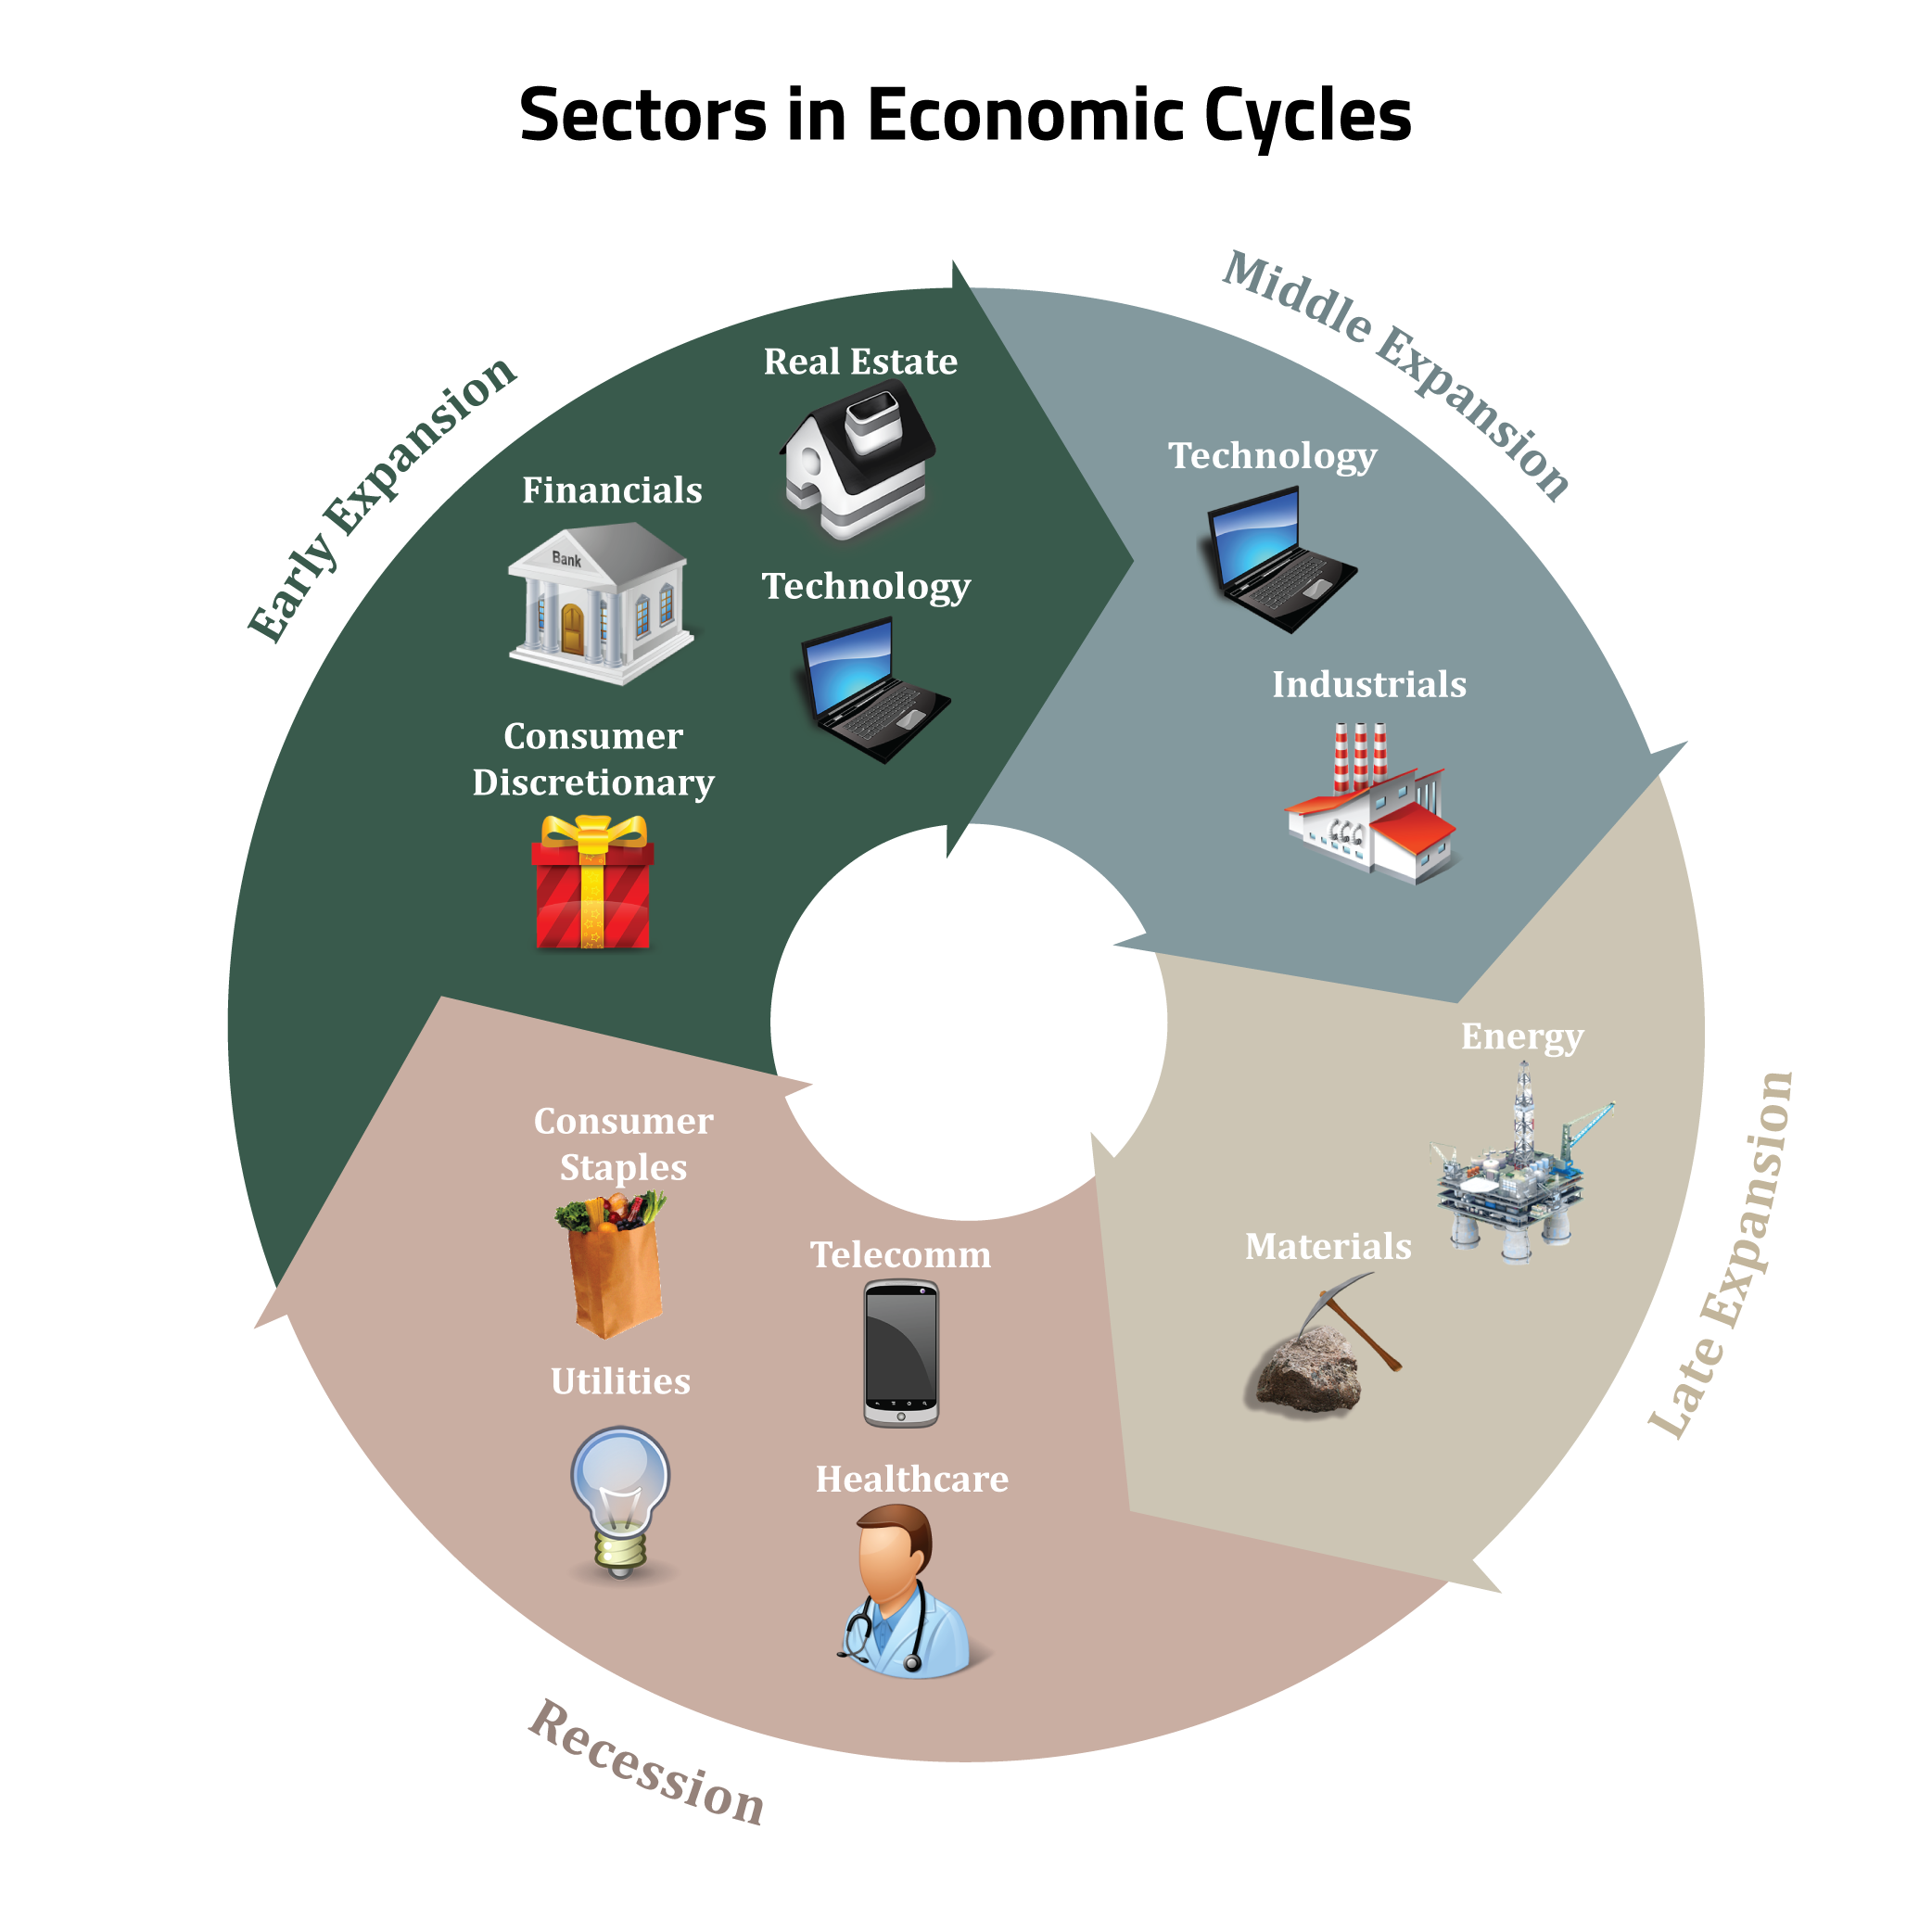
All major public companies belong to one of 11 sectors based upon a classification system developed by MSCI and Standard & Poor’s. Companies within the same sector tend to have higher correlations in their price performance and rate of revenue and earnings growth than companies from different sectors. The unique characteristics of each sector and their tendencies to perform in a different way at various points in the economic cycle offer an excellent means to capitalize on the business cycle.
The following chart displays the varying performance of the 11 sectors within the S&P 500 Index over the last 13 years:
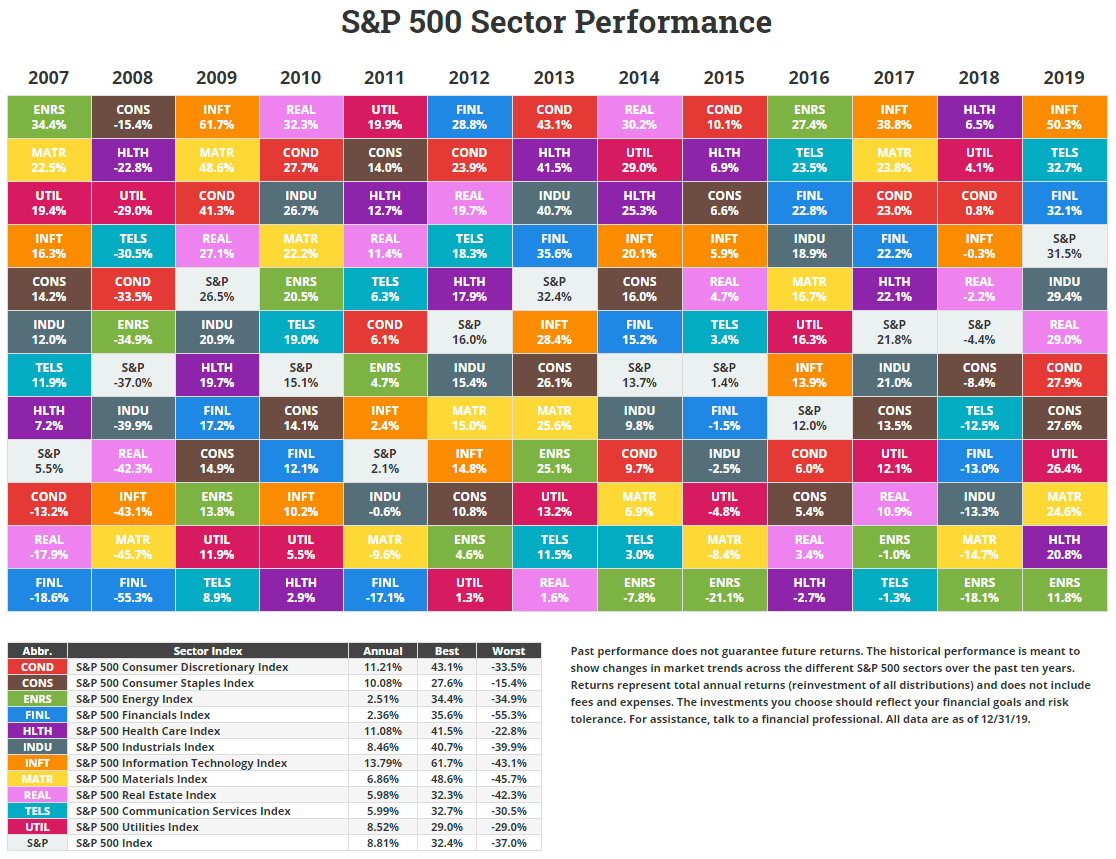
The chart above shows the historical annual total return performance, including reinvestment of all capital gains and dividends, of the 11 sectors represented within the S&P 500 Index. It is meant to show changes in market trends across the different S&P 500 sectors over the 13-year period, 2007-2019. You cannot invest directly in an index, as the returns do not include fees and expenses. Past performance is no indication of future returns and you can lose money by investing into equity sectors. Data provided by Novelinvestor.com.
Description of Sectors
 Consumer Staples – The companies in this sector are primarily involved in the development and production of consumer products people use on a daily basis. This includes food and drug retailing, beverages, food products, tobacco, household products, and personal products. Industries such as automobiles and components, consumer durables, apparel, hotels, restaurants, leisure, media, and retailing are primarily represented in this group.
Companies such as Wal-Mart, Proctor & Gamble, Philip Morris International, and Coca-Cola are classified as consumer staples stocks.
Consumer staples stocks tend to perform best relative to other sectors in the late expansion phase of of the economic cycle and poorest during the middle expansion phase.
 Consumer Discretionary – Industries such as automobiles and components, consumer durables, apparel, hotels, restaurants, leisure, media, and retailing are primarily represented in this group. These companies produce products that people want but don’t necessarily need.
Companies such as McDonald’s, Walt Disney Co., and Comcast are considered consumer discretionary stocks.
Discretionary equities tend to perform best in the early and middle expansion phase of the business cycle and poorest during the late expansion and early recession phase.
 Energy – Companies in this index primarily develop and produce crude oil and natural gas, and provide drilling and other energy-related services.
Companies in this category include companies such as ExxonMobil Corp., Chevron Corp, and ConocoPhillips.
Energy stocks tend to perform best during the middle to late expansion phase of the economic cycle and under-perform during the early and late recession phase.
 Financials – A wide array of diversified financial service firms, insurance, banks, capital markets, consumer finance and thrift companies are featured in this index.
Stocks like Berkshire Hathaway, JPMorgan Chase, Wells Fargo, BankAmerica Corp and Citigroup are in the Financial Sector.
Stocks in this sector tend to perform the best in the middle and late expansion phase of the business cycle and under-perform whenever the Fed is aggressively tightening.
 Industrials – Industries in the Index include aerospace and defense, building products, construction and engineering, electrical equipment, conglomerates, machinery, commercial services and supplies, air freight and logistics, airlines, marine, road and rail, etc.
General Electric Co., Minnesota Mining & Manufacturing Co., and United Parcel are considered industrial companies. Industrial stocks tend to perform best during the late recession and early expansion phase of the business cycle and poorest during the early recession phase.
 Information Technology – Stocks primarily covering products developed by internet software and service companies, IT consulting services, semiconductor equipment and products, computers and peripherals.
Microsoft Corp., International Business Machines Corp., and Cisco are all considered technology companies.
Technology stocks tend to perform best in the late recession and middle expansion phase of the economic cycle.
 Materials – This sector is primarily composed of companies involved in such industries as chemicals, construction materials, containers and packaging, metals and mining, and paper and forest products.
Monsanto, E.I. DuPont de Nemours & Co., and Dow Chemical Co. are examples of stocks in this sector.
This sector tends to perform best during the middle to late expansion phase of the business cycle.
 Telecommunications – Companies that make communication possible on a global scale whether through the phone or Internet. The list includes wireless operators, satellite companies, cable companies and Internet service providers.
Companies like AT&T and Verizon are examples of companies in this sector.
This sector tends to perform best on a relative basis during the early recessionary phase of the economic cycle and worst during the late recession and early expansion phase.
 Utilities – This sector is comprised primarily of companies that produce, generate, transmit or distribute electricity or natural gas.
Companies such as Exelon Corp., Southern Co., and Dominion Resources Inc. are examples of companies that are included in this sector.
Utility stocks tend to perform best on a relative basis during the early recessionary phase of the business cycle and the worst in the late recession and early expansion phase.
 Real Estate – This sector includes companies from the following industries: Real Estate Management & Development and REITs, excluding Mortgage REITs.
Companies such as Simon Property, American Tower, Public Storage, Crown Castle and Equity Residential are examples of companies in this sector.
Real Estate stocks tend to perform best during the late recession phase of the business cycle as they recover from the harshest impact of the early part of recession.
 Healthcare – Companies in this sector primarily include health care equipment and supplies, health care providers and services, biotechnology, and pharmaceuticals industries.
Pfizer Inc., Johnson & Johnson, and Abbott Labs are some of the largest companies in this sector.
Stocks in this sector tend to show their best relative performance during the late expansion phase of the business cycle into the early recessionary phase and then tend to under-perform in the late recession and early expansion phase.
How do Economic Cycles Affect Sector Performance?
The economy moves in cycles above and below its long-term trend of growth. Some sectors perform better than others in different phases of the economic cycle, driven by factors such as corporate earnings, interest rates, consumer expectations and inflation. Cyclical sectors, such as basic materials, consumer discretionary, industrials and real estate, may outperform defensive sectors, such as staples, utilities and healthcare, when the economy is in an upswing. This often reflects improving consumer expectations and optimism about the direction of the business cycle.

How is the Guardian Sector Strategy Managed?
We use a quantitative and fundamental approach to investing in the 11 defined sectors. We increase our allocation to sectors we expect to outperform the market because of the current cyclical trends, valuations and relative strength. We reduce or end our exposure to the others. Typically, our holdings will include exposure to 50-70% of the available sectors. We prefer to implement our strategy with exchange traded funds (ETFs) when possible because they offer a low cost, targeted exposure to 68 industries and the sectors holding them.

On the risk spectrum, a sector fund investment may be less risky than an individual stock, but may at times be riskier than a broadly diversified stock index like the S&P 500. The chart above shows the comparative risk of the Guardian Sector Model relative to other investment models offered through Green Investment Management. The chart below shows the relative risk of the individual sectors versus the S&P 500, as measured by standard deviation, a statistical measure of the historical volatility of an investment.

This is not illustrative of the performance of any strategy or security. Past performance is no guarantee of future results. No investment process is free of risk; no strategy or risk management technique can guarantee returns or eliminate risk in any market environment. Data is provided by Morningstar.
Summary
The Guardian Sector Model offers investors the potential to gain alpha for their portfolios by capitalizing on the differing phases of the economic cycle.
The investments you choose should reflect your financial goals and risk tolerance. Talk to your financial advisor and discuss whether investing in the Guardian Sector Model is right for you.
Disclosures:
The strategy invests in exchange traded funds (ETFs), mutual funds and in the case of variable annuities, separate accounts. In each case, these investment vehicles are subject to expenses, which will be indirectly paid by the investor. The cost of investing in a strategy that invests in ETFs, mutual funds or variable annuity separate accounts may generally be higher than the cost of investing in a strategy that invests directly in individual stocks. Investing in ETFs, mutual funds or variable annuity separate accounts is not equivalent to investing directly in an index or in any index components. Investment return and principal value will fluctuate so that shares in the underlying investments, when redeemed, may be worth more or less than their original cost. Sector or industry focused securities may involve additional risks than broader based indexes, including sector risk and non-diversified risk, which will result in greater price fluctuations than the overall market. Performance data current to the most recent month end is available by calling 800-950-8004. This Model invests in equity funds. In it we make concentrated investments into equity sectors of the market that are demonstrating relative strength or represent unusual value in our opinion. We actively monitor and alter it to maximize returns within reasonable risk parameters. This allocation is most suitable for clients with a high tolerance for variable returns who seek aggressive long-term growth. GIM does not employ the use of leverage in any of its portfolios. However, the underlying mutual funds, annuity sub-accounts, or ETF’s may employ techniques to achieve its goals by engaging in short sales and using swaps, futures contracts and other derivatives. To the extent these techniques are used by the underlying investments, additional risks will exist. Investors should consider whether these types of investments are appropriate for their portfolio. Request Form ADV Part 2 for a complete description of Green Investment Management, Inc.’s services. Investors should read the document carefully, including the investment objectives, risks, charges and expenses of the strategies they are considering. Market and economic conditions can change rapidly producing materially different returns (or losses) over different periods. Investing involves risk and you may incur a profit or a loss. Past performance is no guarantee of future results. This information was gathered in a way that GIM believes to be reliable, but accuracy is not guaranteed. The returns used for the indexes and composite returns are total returns, which include reinvestment of dividends and capital gains. Indexes represent securities widely held by investors. You cannot invest directly in an index. Standard deviation is the statistical measurement of dispersion about an average, which depicts how widely a stock or portfolio’s returns varied over a certain period of time.