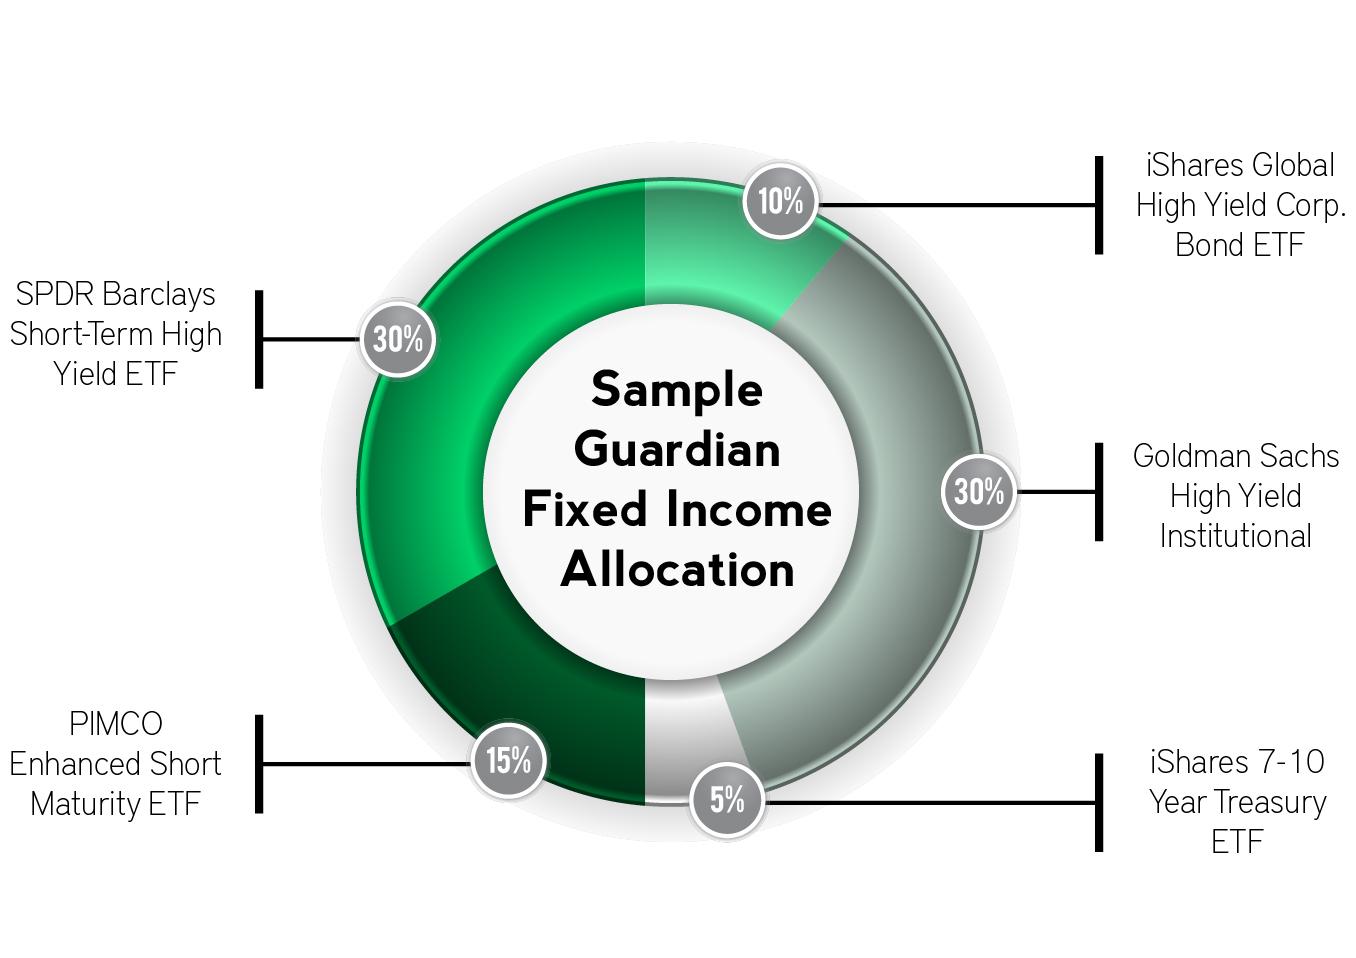
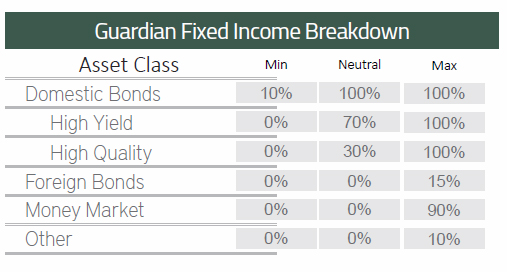
The Guardian Fixed Income allocation is a flexible fixed income strategy with broad latitude to vary its investment mix in order to balance the risks and opportunities inherent in different market and interest rate cycles. By actively departing from the normal “strategic” mix of the portfolio, we seek better risk-adjusted returns than a similarly allocated static portfolio. Departures are confined within “tactical” ranges, which are pre-determined minimum and maximum exposures. Once the risk or opportunity that prompted a tactical departure is determined to have passed, we return the portfolio to its original strategic mix.
By actively monitoring global macro-economic and interest rate data such as credit spreads, corporate leverage, earnings and default outlooks and other leading indicators, we move the Guardian Fixed Income portfolio bond selection along a spectrum between high quality and high yield, as well as shorter or longer duration. This creates the potential for returns in both rising and falling interest rate environments, across the full economic and interest rate cycle.
Sample Allocation to the right is for informational purposes only; the actual holdings will vary significantly over time. This is not intended as a recommendation to buy or sell any of the securities represented here. See disclosures at the bottom of this page.
Key Investor Benefits
Income
Designed for investors who place a premium on principal preservation and seek income as well as growth.Principal Protection
Markets can be inefficient in their reaction to macro factors in the short to medium term. This strategy seeks to tactically adjust the asset allocation mix to improve alpha and manage downside risk.Experience
This conservative strategy has been overseen by the same skilled lead manager (Byron Green) for over 24 years.ETFs
The use of ETFs minimizes the cost of the strategy, while improving its transparency and tax efficiency.Why Bonds?
You’ve probably heard the prognostications: “Interest rates will rise in the coming years, so bonds are not the right choice now for your portfolio.” There are several problems with this reasoning. The first is that it treats all bonds the same, when they actually comprise a range of assets that vary along dimensions such as duration and credit quality.
For instance, high-yield issues, particularly convertibles, often behave like equities, while Treasuries tend to be negatively correlated with equities. Active management among these different types of bonds is capable of producing returns in very different interest rate environments, rising or falling.
There is also more to the return of a bond than its capital gain or loss. Income is a key consideration. Over the last 15 years, when interest rates have been generally falling, income has been the primary driver of bond performance.
As the chart to the right indicates, from 2000 through 2014, the Bank of America Merrill Lynch High Yield Master II Index derived all of its total return from income (yield), with capital losses detracting 3% from returns.
And rising rates can enhance the return from income. This brings the potential of overcoming capital losses when the bond portfolio is actively managed and management is free to move along the spectrums of duration and credit quality.
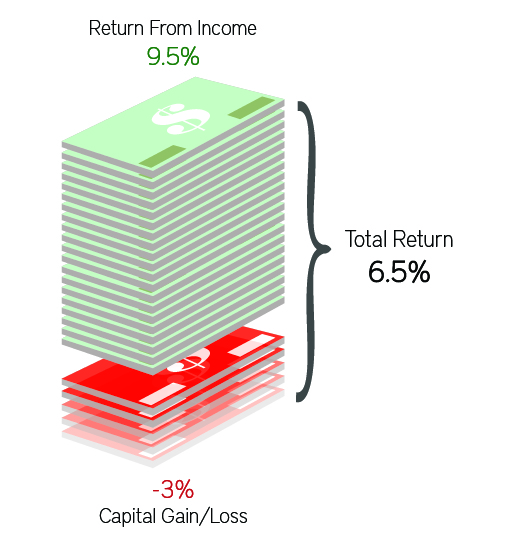
Source: BofA Merrill Lynch Global Index System. Yield returns are based upon the index yield at the beginning of each annual period. Past performance is no guarantee of future results. The performance of an index is not representative of any particular investment, as you cannot invest in an index. See disclosures at the bottom of this page.
Why Not Equities?
Equities are an important part of a portfolio, and so are bonds. In the absence of a crystal ball, diversification is an essential hedge against market turmoil that includes both.
We don’t have to look back further than 2008 to be reminded of an instance when Treasury bonds were one of the few assets to rise while virtually all other asset classes declined. And unlike gold, bonds are a hedge that can produce income for the investor while providing diversification.
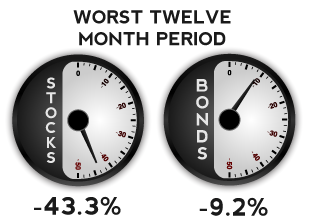
The S&P 500 and the Barclays Aggregate total return indices represent stocks and bonds, respectively. Past performance is no guarantee of future results. The performance of an index is not representative of any particular investment, as you cannot invest directly in an index. See disclosures at the bottom of this page.
In Good Times and Bad Times
The Guardian Fixed Income’s 24-year performance history is shown here.
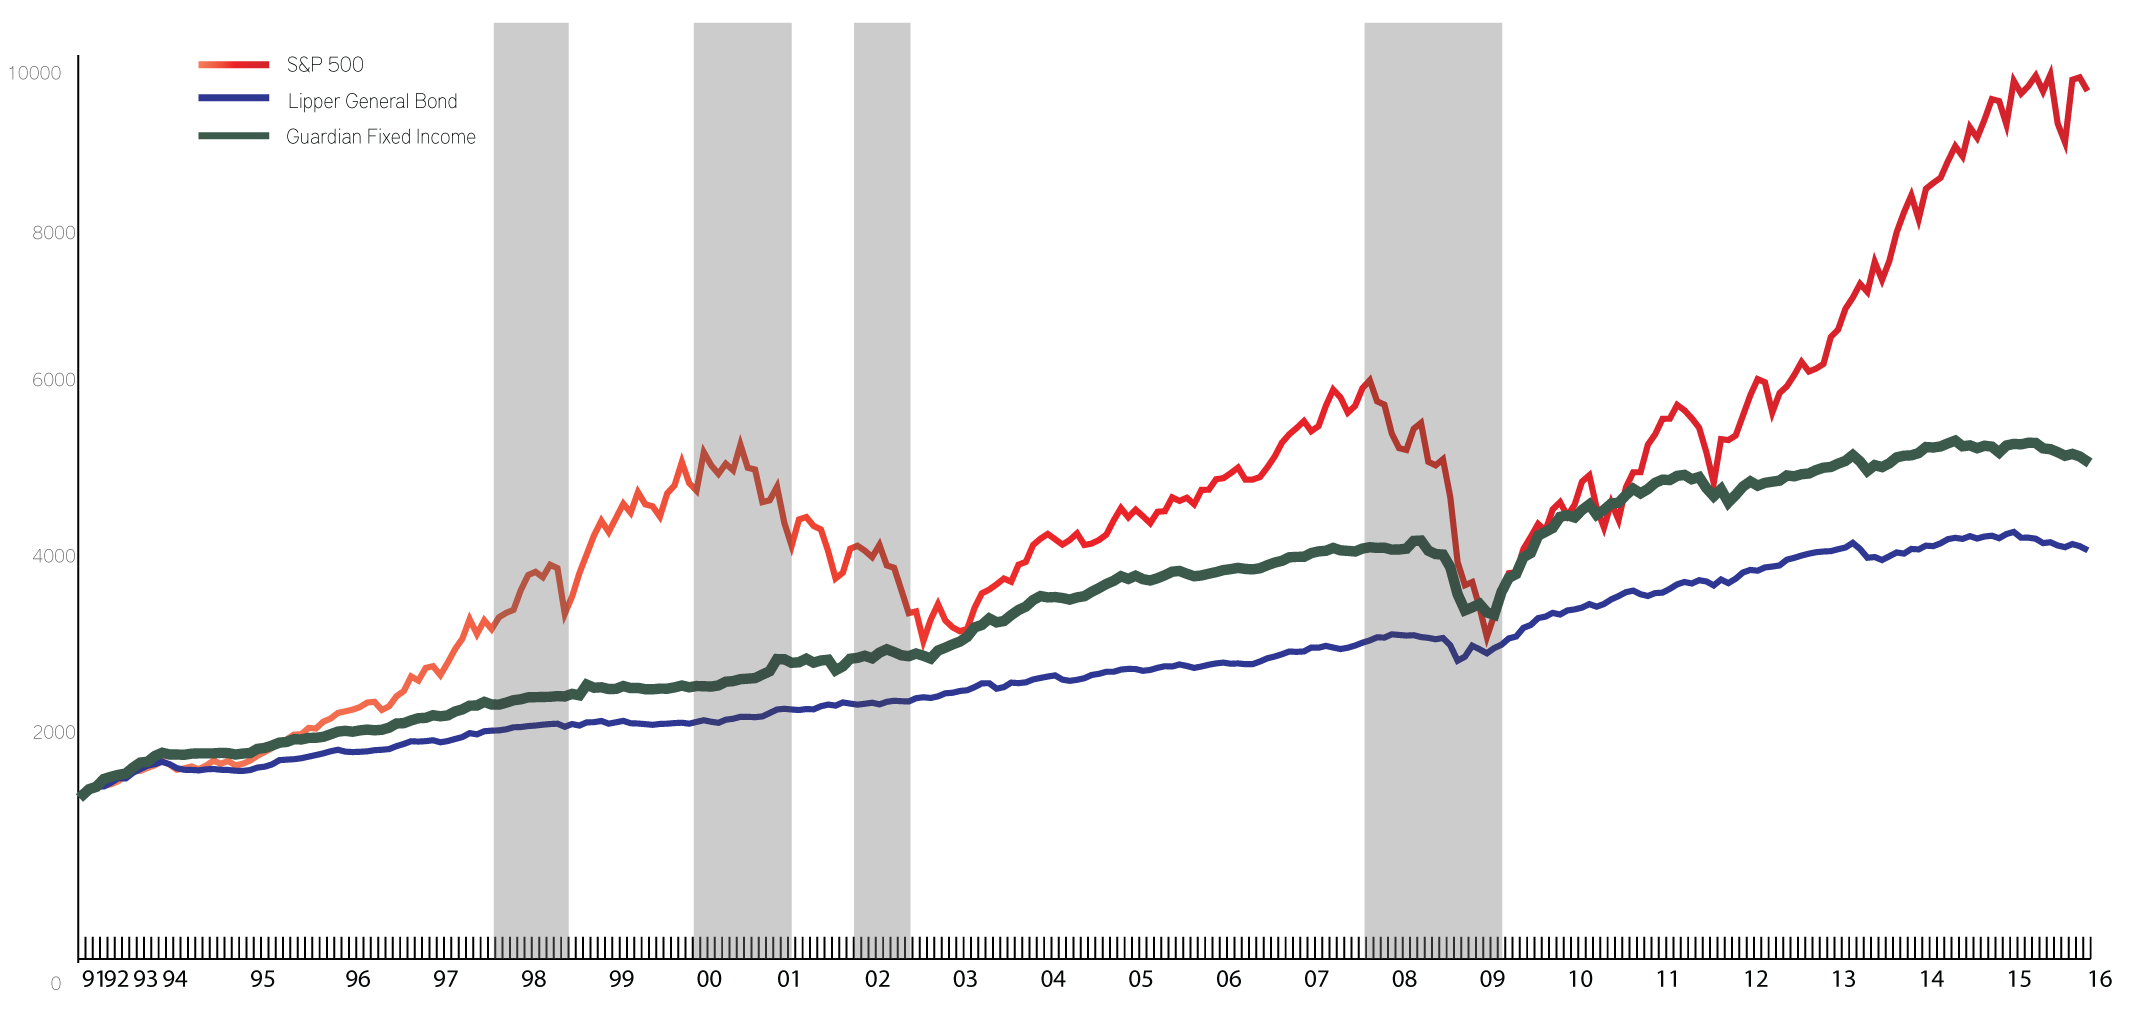
This period includes some of the worst black swan events (marked in grey) in market history, through which the value of the portfolio continued to push higher after the market low.
Footnotes: 1 Data for 10 years plus since inception numbers for allocations in existence more than 5 years are all considered to be SUPPLEMENTAL. Performance results are based on the reinvestment of all income, dividends and capital gains and are net of fees. All returns displayed are calculated in U.S. dollars. Investing involves risk and you may incur a profit or a loss. Past performance is no guarantee of future results. The S&P 500 and the Lipper® General Bond total return indices are presented for comparison purposes and are described in more detail in the Disclosures section. The performance of an index is not representative of any particular investment, as you cannot invest directly in an index.
A Tale of Two Retirements
“How should I invest my retirement savings?” is an imperative question for anyone in or nearing retirement. Consider this fictional scenario illustrating the advantages of the Guardian Fixed Income strategy.
The Smiths

The Smiths had used their $300,000 to purchase 1-year Treasury notes, a very safe investment that paid them 3.8% income the first year. Every year they rolled the money into new 1-year Treasuries. The Smiths annual income from this investment varied with Treasury rates.
The Joneses

The Joneses, on the other hand, had invested their $300,000 in GIM’s Guardian Fixed Income strategy. They took an initial annual distribution identical to the Smiths. They increased this distribution by 2% each subsequent year to account for inflation.
Did the Smiths keep up with the Joneses?
As the illustration below shows, not only did the Joneses receive more distributions in total over their 20-year retirement than the Smiths, their retirement fund also grew significantly over that time.
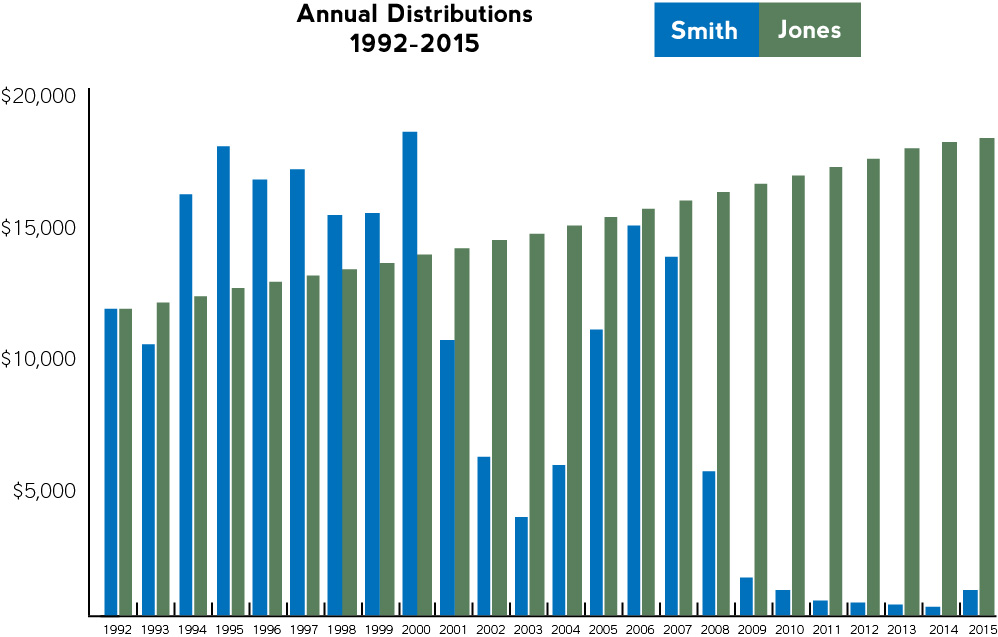
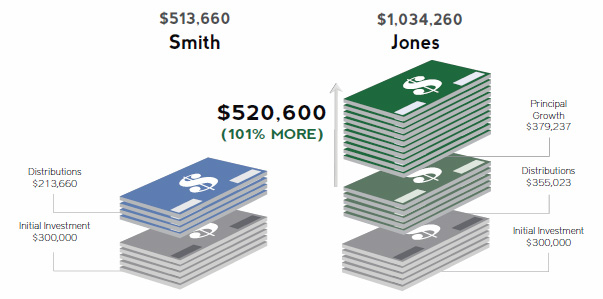
The Moral: Sometimes “low-risk” investments (such as Treasuries) may provide short-term peace of mind but long-term disappointment.
Data used to represent the 1 year U.S. Treasury Note returns was obtained from the Federal Reserve using the 1 year constant maturity rate. Dividend and capital gain income from the Guardian Fixed Income strategy that was not paid out to the Joneses each year was assumed to be reinvested. Returns displayed are calculated net of fees and in U.S. dollars. Investing involves risk and you may incur a profit or a loss. Past performance is no guarantee of future results. The performance of an index is not representative of any particular investment, as you cannot invest directly in an index.
See disclosures at the bottom of this page.
Staying Power Pays
Long-term investors are typically rewarded for their patience. The charts to the right show annual, calendar-year returns for the Guardian Fixed Income strategy since inception.
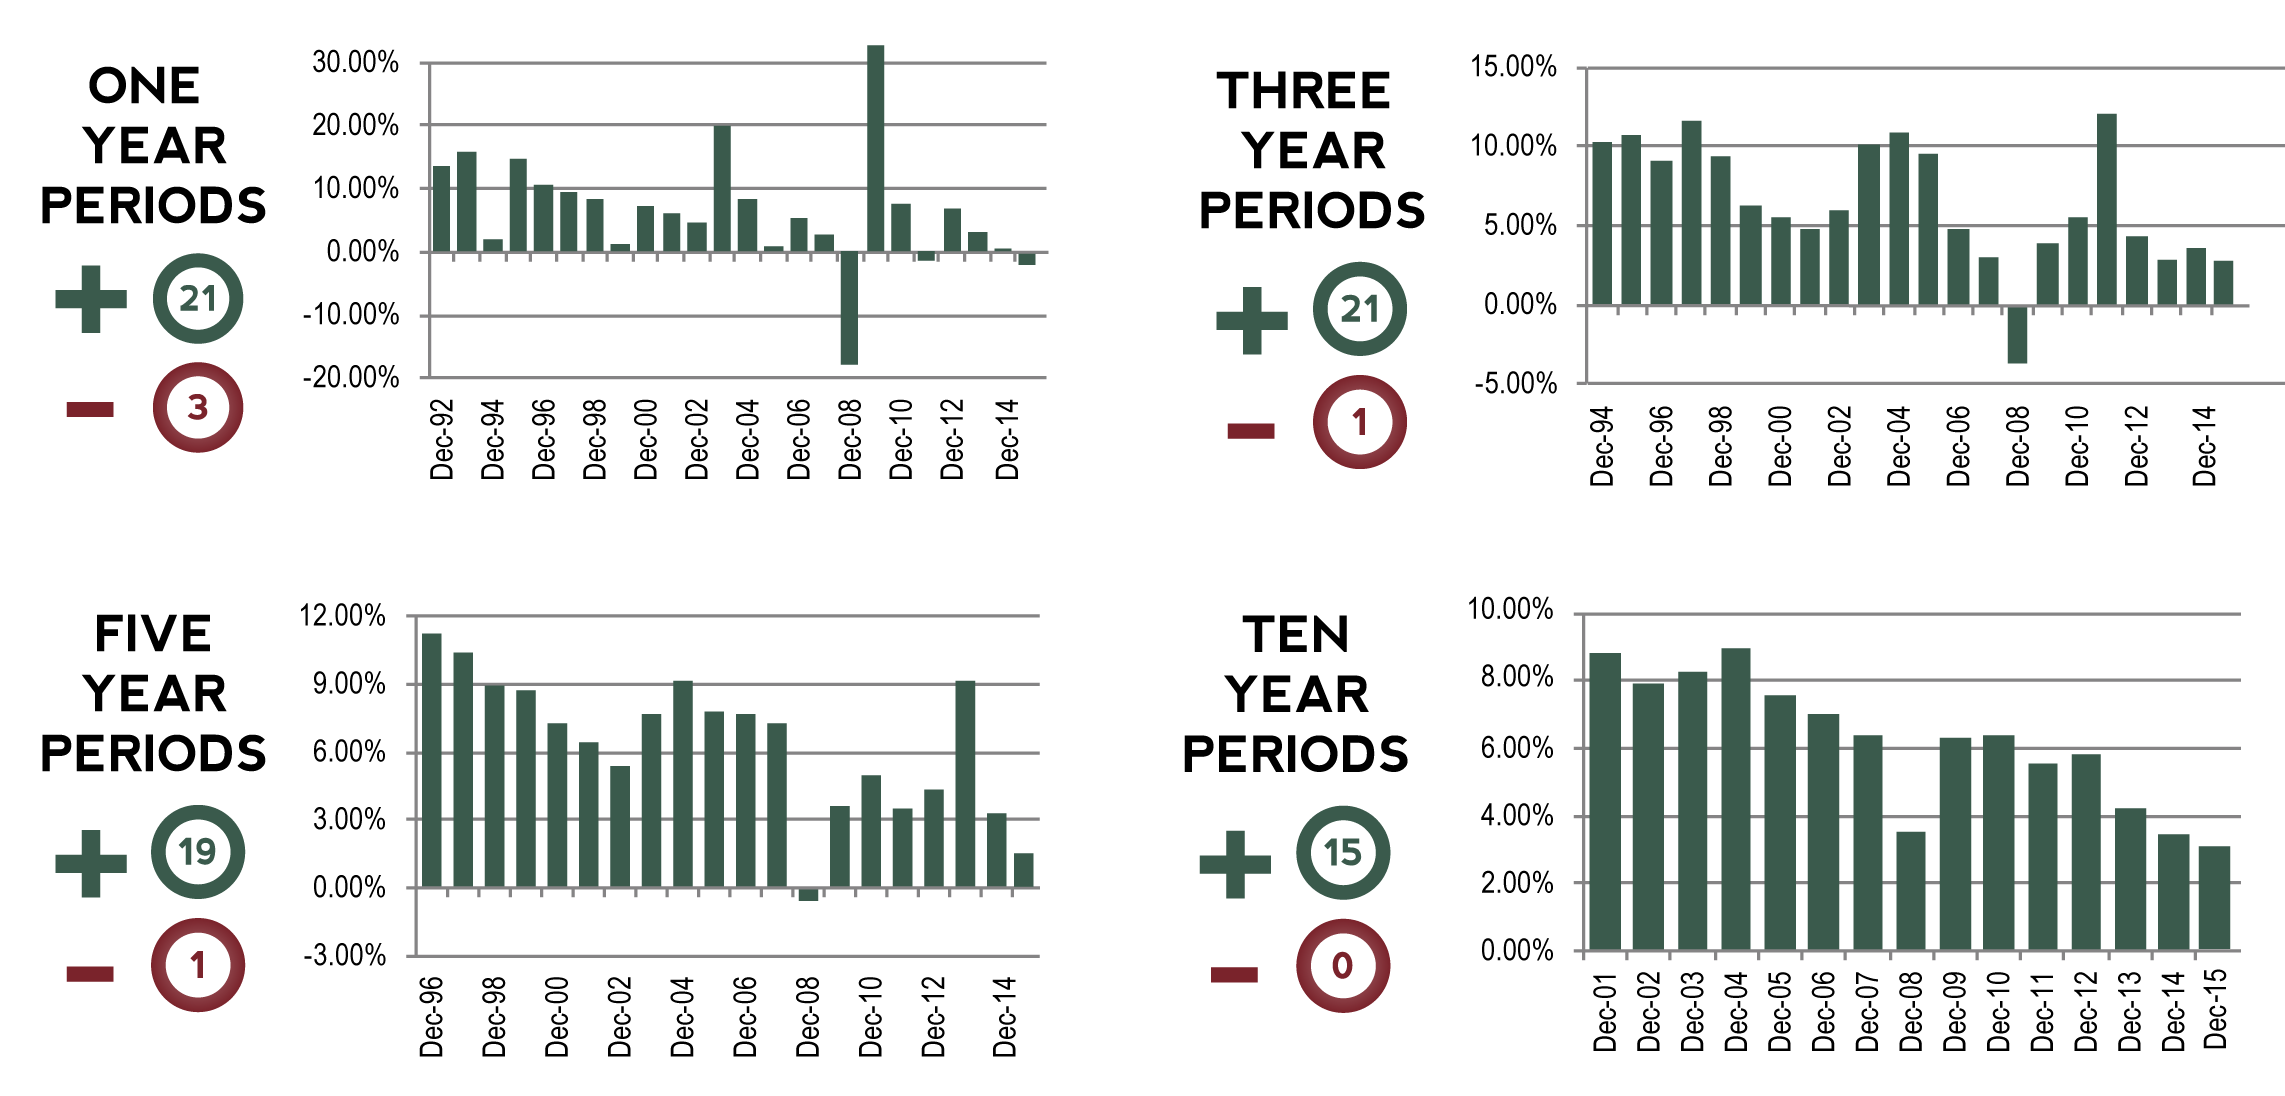
Note: The longer the holding period, the less the likelihood a negative total return will be experienced. As demonstrated above, presently no 10 year calendar period has experienced a negative return.
In the real world, of course, not everyone invests by strict calendar years. The charts below show the Best, Median, and Worst returns with the Guardian Fixed Income strategy for all possible 3-year, 5-year, 10- year and 15-year rolling holding periods. Below each circle are the dates of each period and the growth of $1,000 over that amount of time.
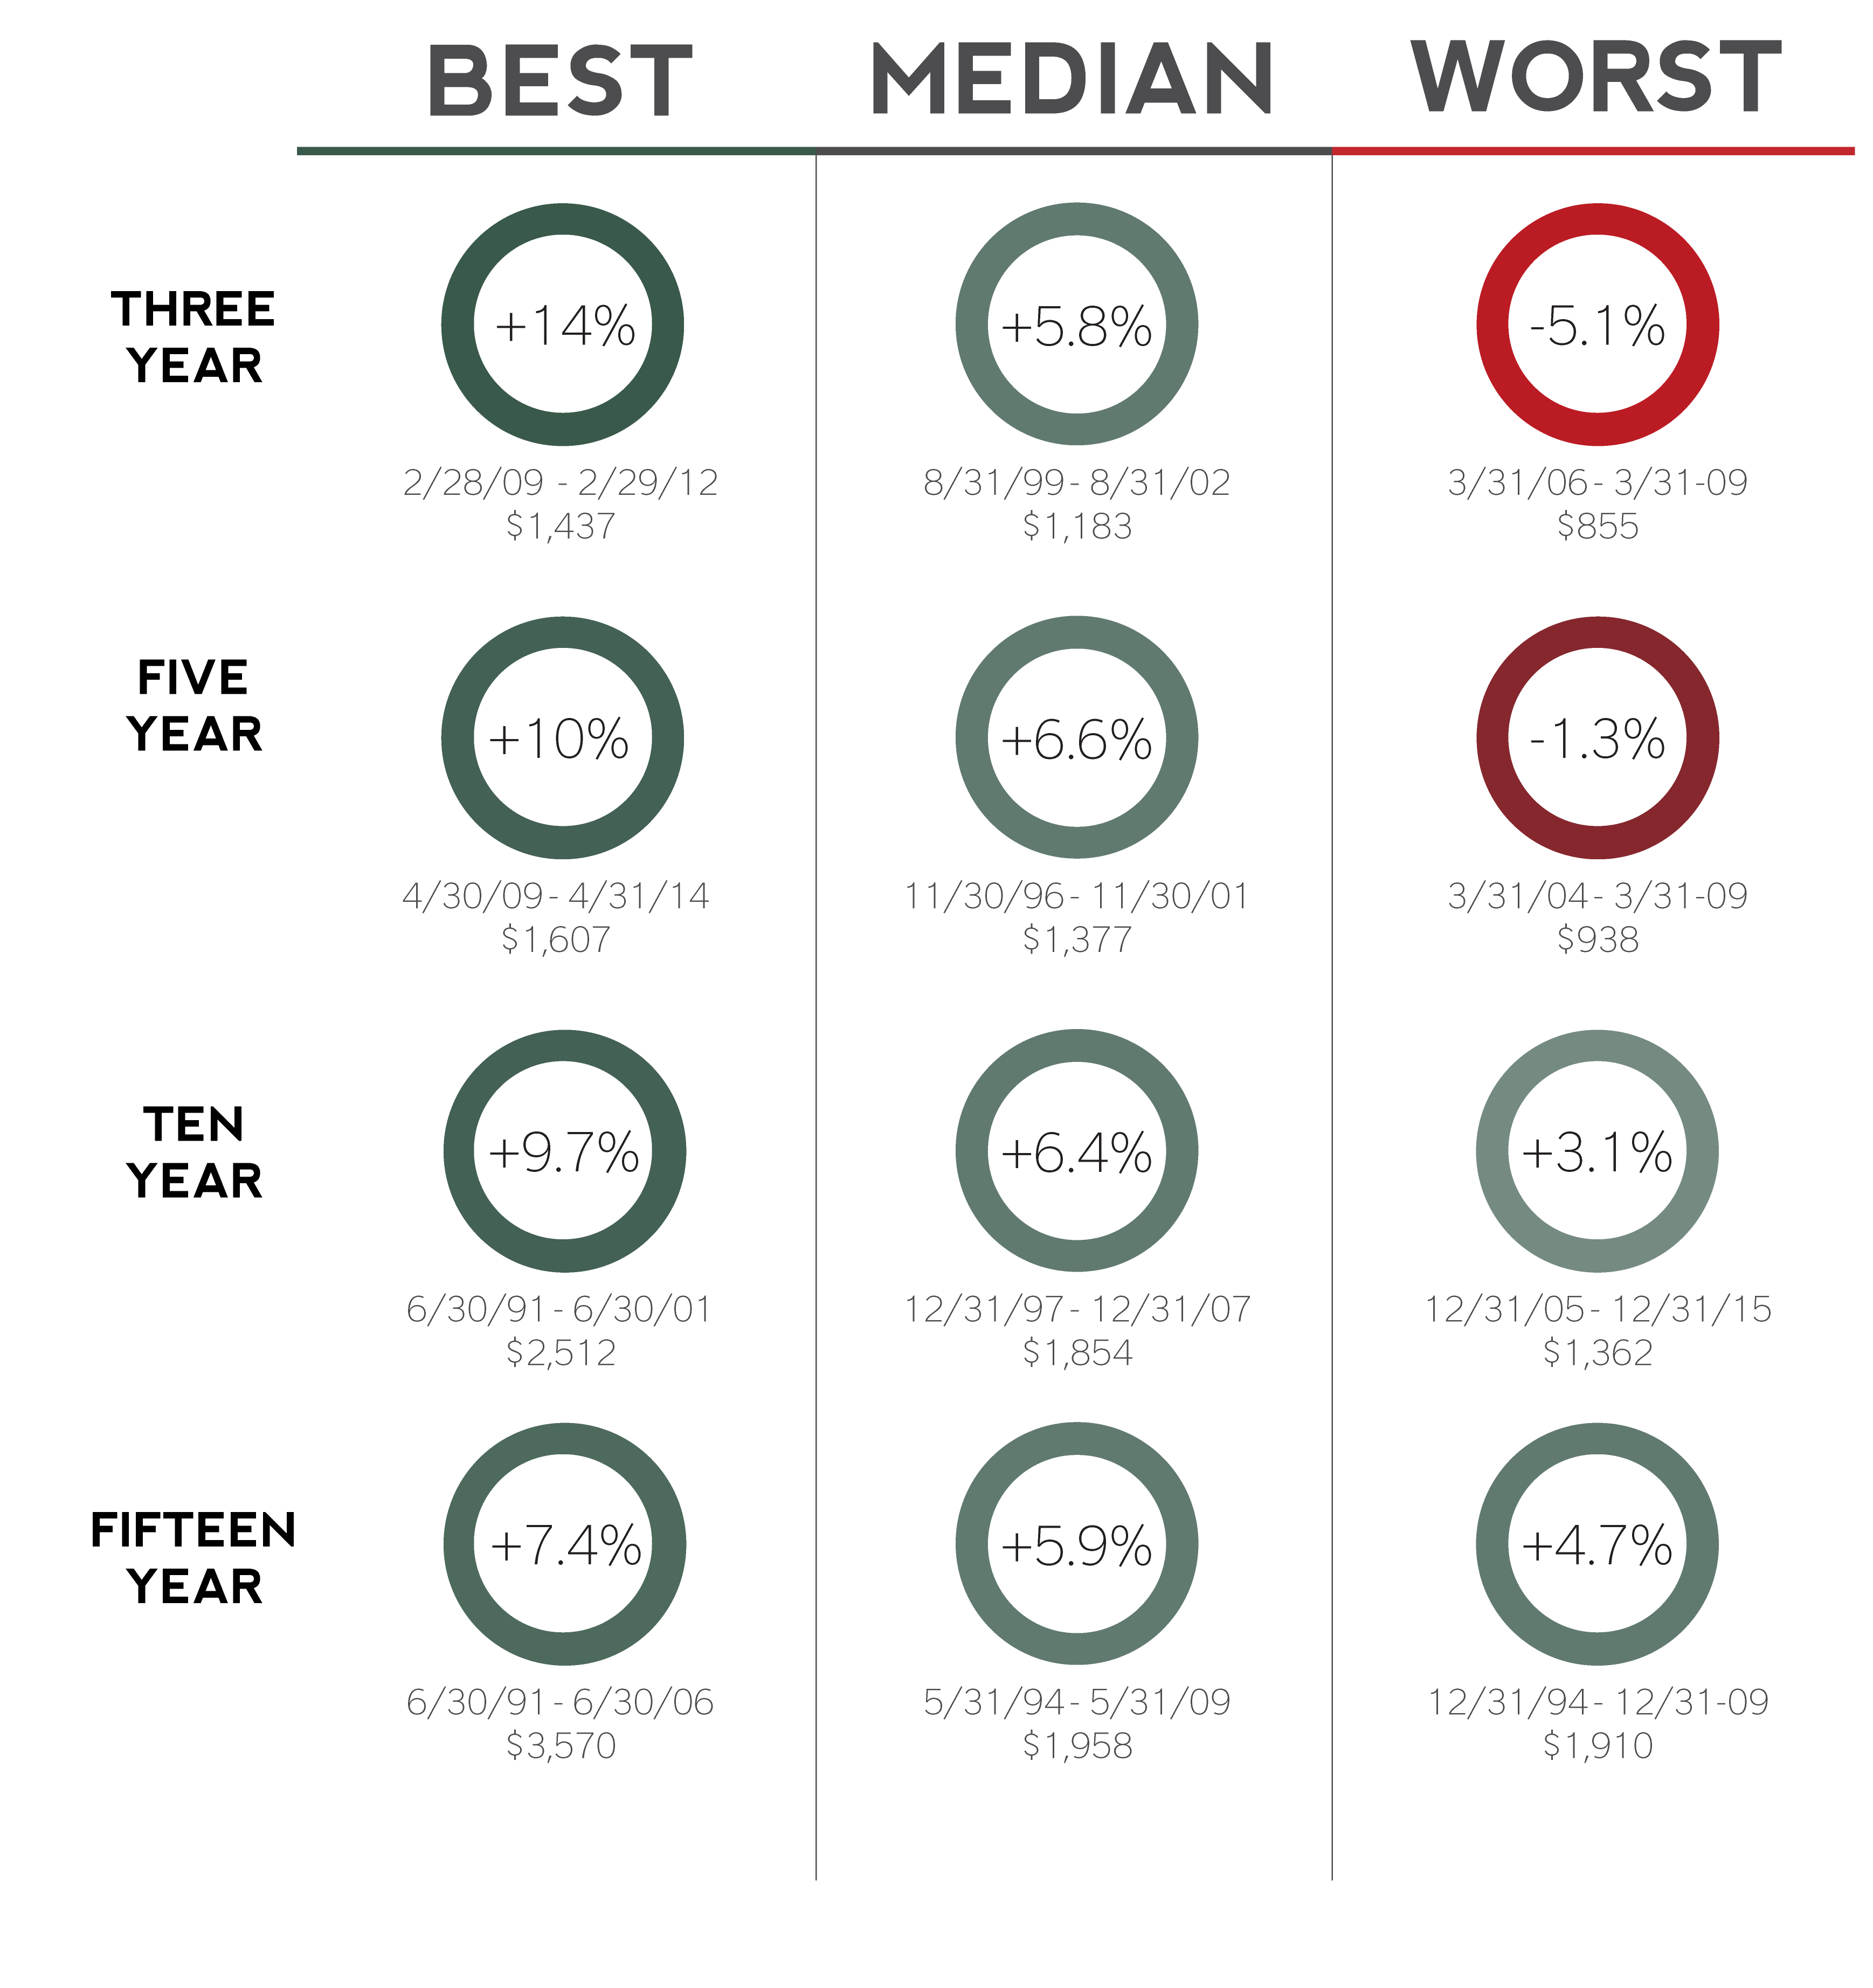
The illustration above displays the best, median and worst rolling period returns for each of the stated periods of time for the Guardian Fixed Income strategy from the inception date of 7/1/1991 until 12/31/2015. Rolling returns offer a useful look into Guardian Fixed Income’s fuller return history and can help investors see through the haze caused by the latest data. By looking at rolling returns, investors can gain a full appreciation for how the strategy’s returns stack up at any point in time, not just through the latest year-end. Performance results are shown in U.S. dollars and are based upon the reinvestment of all income, dividends and capital gains and are net of fees. Investing involves risk and you may incur a profit or a loss. Past performance is no guarantee of future results. Additional disclosures regarding the use of indexes, ETFs, ETNs and mutual funds are also found on the bottom of this page.
The Best of Times, The Worst of Times
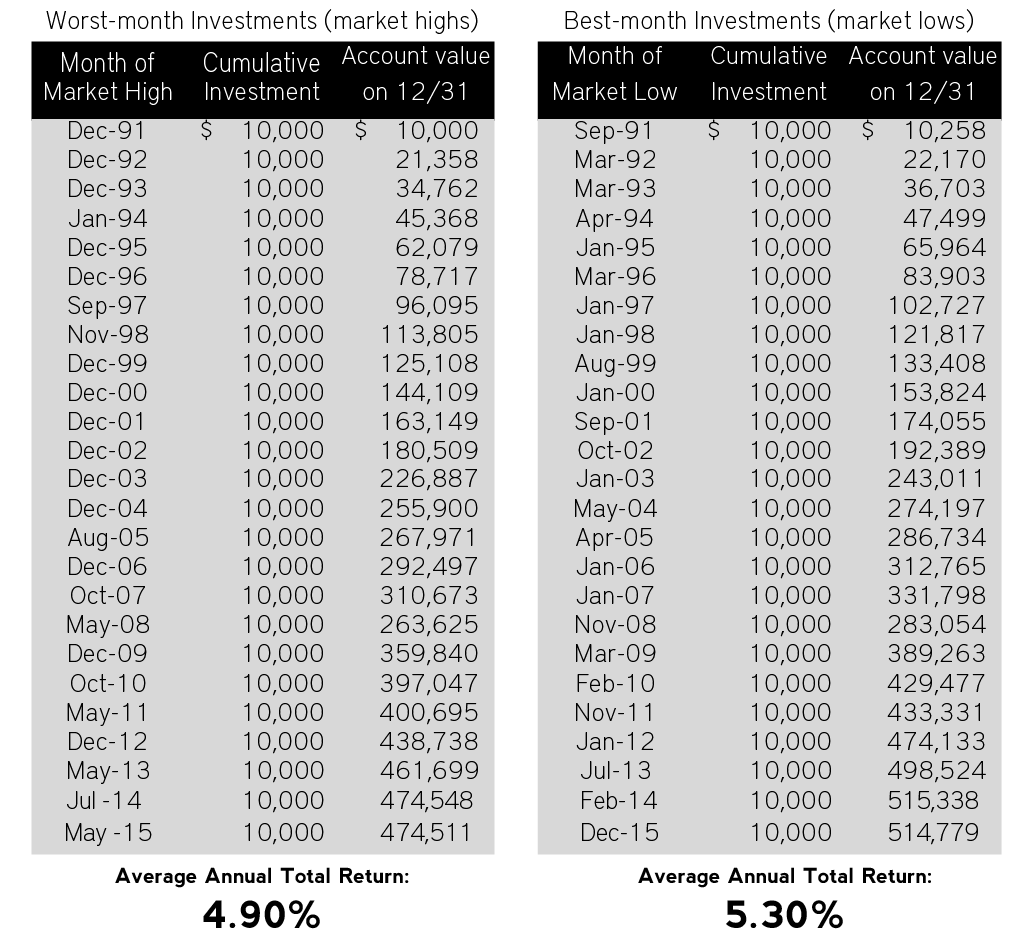
The tables below illustrate how you could have performed if you invested $10,000 each year in the worst month (market high) versus the best month (market low) in the Guardian Fixed Income strategy beginning in 1991. It’s clear, there has been little difference in the outcome of investing in the worst month of each year versus the best.
